In this article we describe the Pareto Analysis, in which 80% of effects arise from 20% of causes.
Introduction: What is the Pareto Effect?
Pareto Effect concerns cause/effect and says that in many cases 80% of effects arise from 20% of causes. An example: 80% of the revenue is generated by 20% of the clients. That is why it is also known as the 80/20 rule. Commercial applications of the Pareto Effect:
- 80% of profits comes from 20% of clients.
- 80% of complaints comes from 20% of clients.
- 80% of profits arises from 20% of the product portfolio.
- etc.
The Pareto Effect also stands on the basis of Curry’s Client Pyramid. Read more about it...
Pareto Analysis
Now that the Pareto Effect is known, it’s time for the Pareto Analysis. Pareto Analysis can apply for everything, but in this case we tackle complaints as an example. 20% of the main causes are responsible for 80% of problems. By making this clear, the process can be optimised.
Pareto Analysis example
A simple example of Pareto Analysis with regards to complaints.
Step 1 Summarising
First, make a summary of all the complaints. In this case there are 34.
Step 2 Grouping
Group the complaints as they fall in the same category. Often a dataset arises with well over 100+ different situations where the 100 situations can be summarised into 10 categories. In this simple example, only 5. Example: Dissatisfaction over a Restaurant.
- Group A: Quality of the meal
- Group B: Serving personnel
- Group C: Menu chart
- Group D: Entourage
- Group E: Waiting time
Step 3 Quantifying
Quantify the different Groups. For example:
- Group A 15x
- Group B 8x
- Group C 6 x
- Group D 3x
- Group E 2 x
Step 4 Plotting
Make a table of the Groups, Absolute, Percentage and Cumulative. Example:
| Complaints | Absolute | Percentage | Cumulative |
| Group A | 15 | 44% | 44% |
| Group B | 8 | 24% | 68% |
| Group C | 6 | 18% | 85% |
| Group D | 3 | 9% | 94% |
| Group E | 2 | 6% | 100% |
| Total | 34 | 100% | 100% |
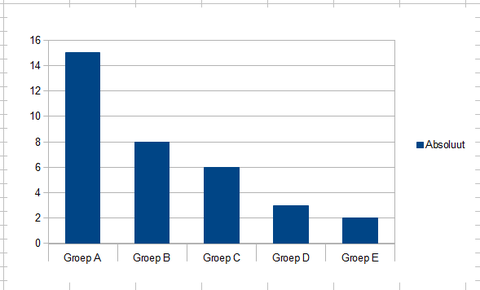
After that make a bar graph and begin with the biggest Group (sloping).
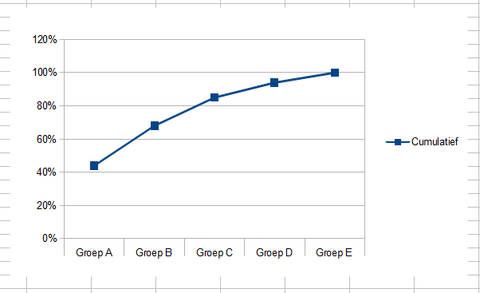
Make a cumulative graph.
Step 5 Analysing
Via this simple example it can clearly be shown that out of 34 complaints a solution for a big portion of the problems can be realised by solving Group A and B (68%) or A, B and C (85%). Now, it is also possible to analyse 34 complaints without the Pareto Analysis, but for serious problems of 100+ it makes for a convenient aid.
Step 6 Action plan
Now that the most important problems have been identified an action plan can be made to solve the problems.