
In this article we describe the BCG Matrix, the model can be used in finding the balance within the present product portfolio to Stars, Cash Cows, Question Marks and Dogs.
What is the BCG Matrix?
The BCG Matrix was developed in the 70’s by the Boston Consulting Group and since then plays an important role in the Portfolio Analysis. The model can be used in finding the balance within the present portfolio to Stars, Cash Cows, Question Marks and Dogs. Furthermore, it is input for an organisation’s strategy.
Why the BCG Matrix?
The BCG Matrix is a fairly easy marketing model with which the portfolio of a business can be analysed. Thereby entrepreneurs can take subtantiated decisions with regards to the portfolio and the strategy to be followed.
What does the BCG Matrix consist of?
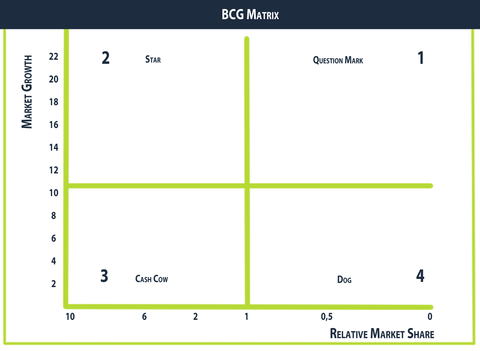
The model distinguishes two axes:
- Horizontal: Relative market share Market share of a certain product/service or business unit with regards to the biggest player in the market. (one’s own market share / market share of the biggest competitor) The middle is positioned at score “1”. Everything above this score implies a greater market share than the competitor.
- Vertical: Market growth Growth of a certain product/service or business unit. The middle of the matrix is positioned at 10% growth. Everything under this line stands for lower than 10% growth, above the line stands for 10+%.
How does the BCG Matrix look like?
This gives the following model:
Question Mark
Low market share, high market growth. Supplying little but costing much money. With the correct strategy and money the “question mark” can grow into “star”.
Star
High market share, high market growth. “Stars” are leaders within their market and thereby also generate a large amount of money. On the other hand, much investment is needed in order to extend or preserve the position. Thereby the net yield of the “star” is often minimal. Grow into “Cash Cow”.
Cash Cow
High market share, low market growth. A “Cash Cow” needs to be milked out. The leading position of the “Star” is successfully retained and through the low growth (mature market) there is little need for more investment. Quietly recoup money and keep it profitable as long as possible. With the “Cash Cow”, the “Question Mark” and “Star” are financed.
Dog
Low market share, low market growth. Little profit but also low costs. In principle there can be only one market leader, but in practice there are many products in this category. Avoid high expenses, financial rescue plans and discard the products when they cost much money.
Marketing Implications
Star - holds minimal position, preferably extend position by investing. The “Star” must grow into “Cash Cow”. Cash Cow - holds minimal position. Ensure that het product does not loose popularity and strive to prolong the lifespan. Dog - When a product is (still) profitable and it has been “milked” to a reasonable extent until it costs money. Retract from the market when a product is making losses. Invest no more money. Question Mark - For some “Question Marks” it doesn’t hold true that a growth strategy needs to be impelemented in order to elevate the product to “Star”. Others will likely never be profitable and needs to be divested. This is a difficult assessment that a manager must make. He can let himself lead throughout the phase of the product’s lifecycle. Introductory phase can be worthy of investment, maturity phase is less attractive.
Critique
Market share is not guaranteed for profit. Market growth can be influenced by an organisation (such as giving an impulse) whereby it is no longer an established fact. The model does not take the competition into account. Interdependence between products is not included. In practice, two products can be strongly dependent upon one another. The model does not take the market into account. A market can, for example, dissipate without warning.
Conclusion
It can generally be established that the BCG Matrix provides a simplistic presentation of facts. This, by definition, is not necessarily a disadvantage. BCG Matrix is the most well-known model in Portfolio Analysis mostly for its simplicity. The model is simple and easy to understand. Thereby it offers everyone an analysis method with which reasoned decisions can be taken based on facts. It is therefore an excellent model despite the critical remarks.